【2019 红点奖】Dashboard For Princeton Island Grid / 电网
0赞|0评论|666人气|1收藏|2020-03-28 17:16:26
关注
私信
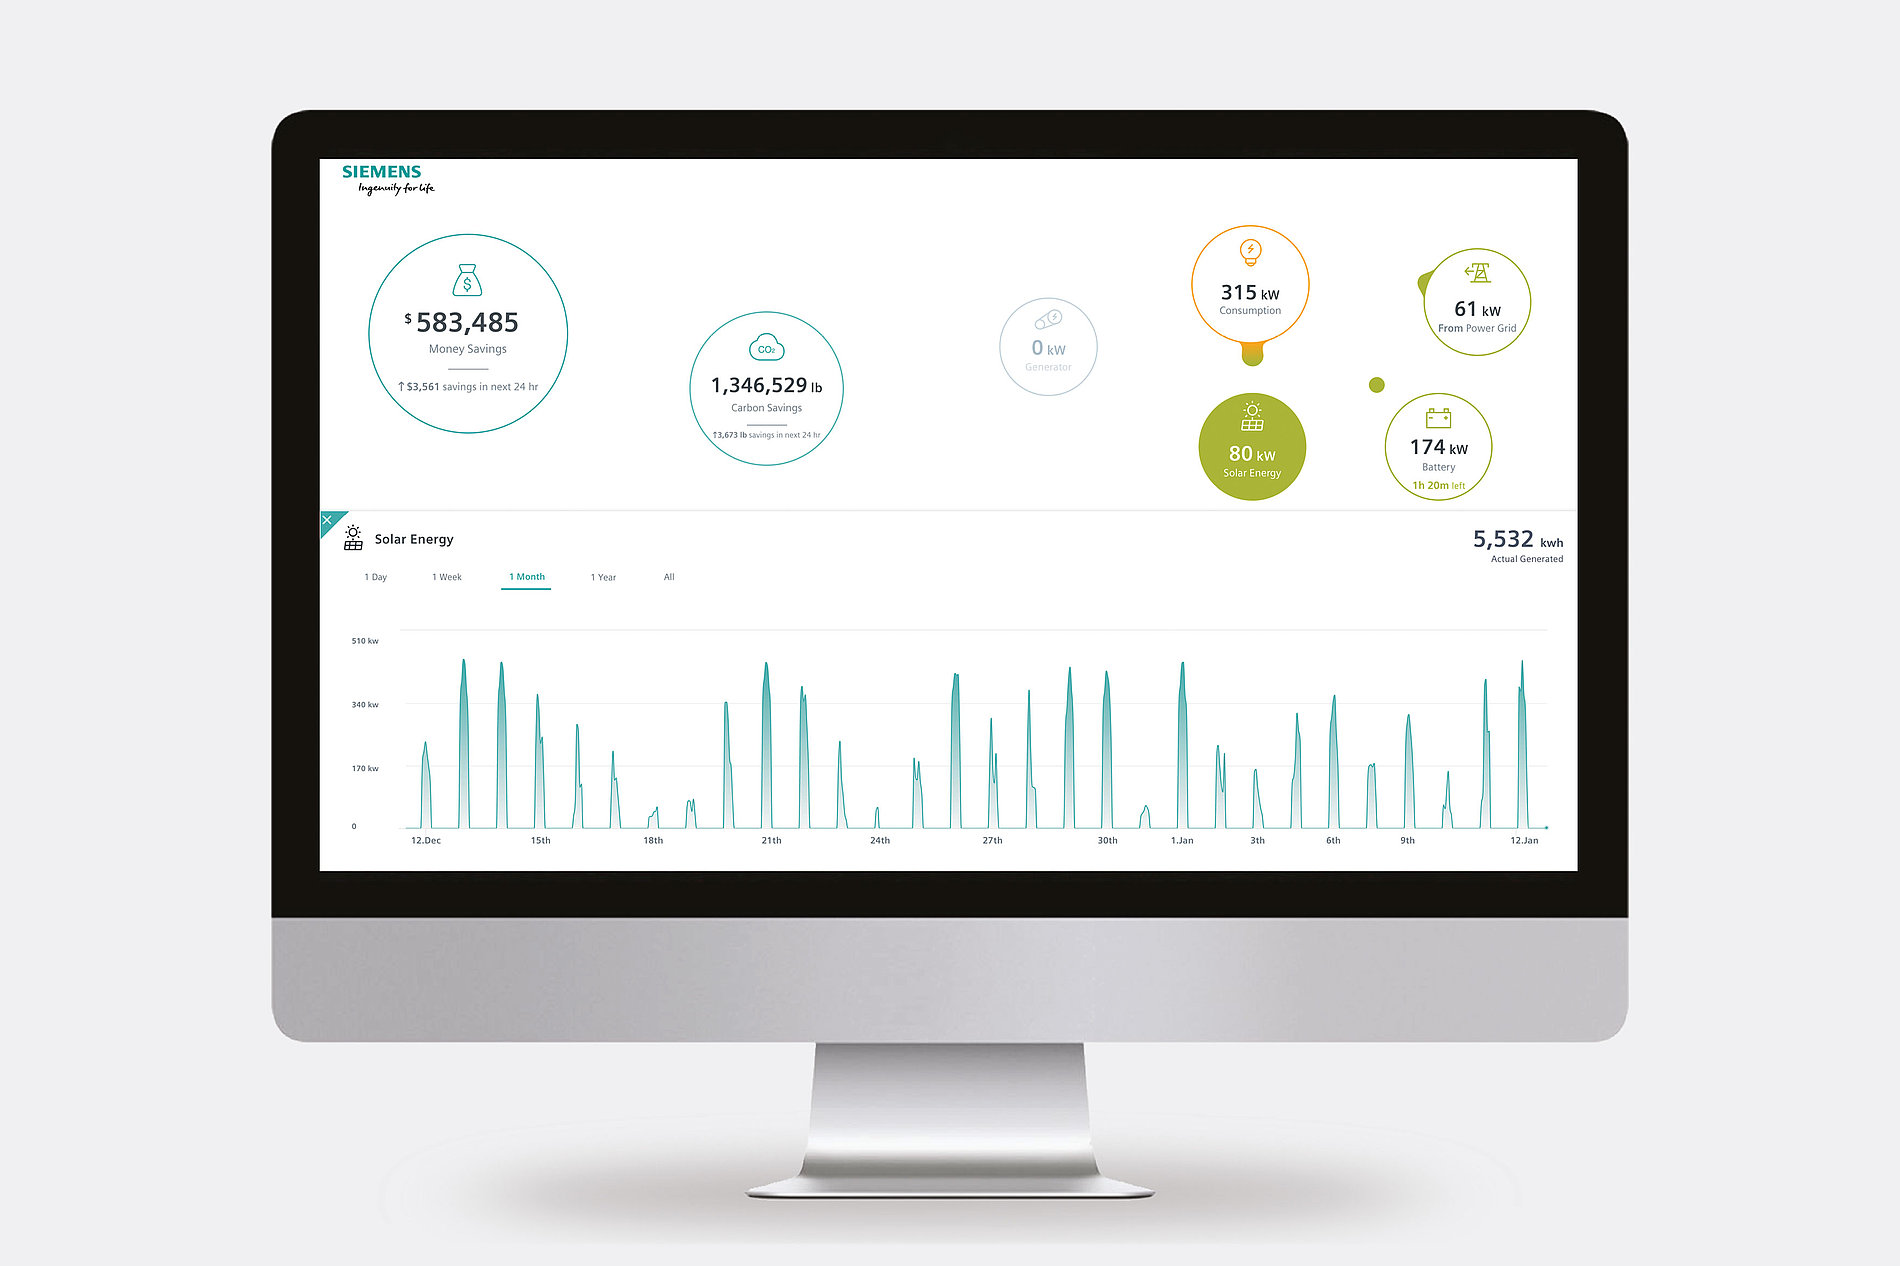
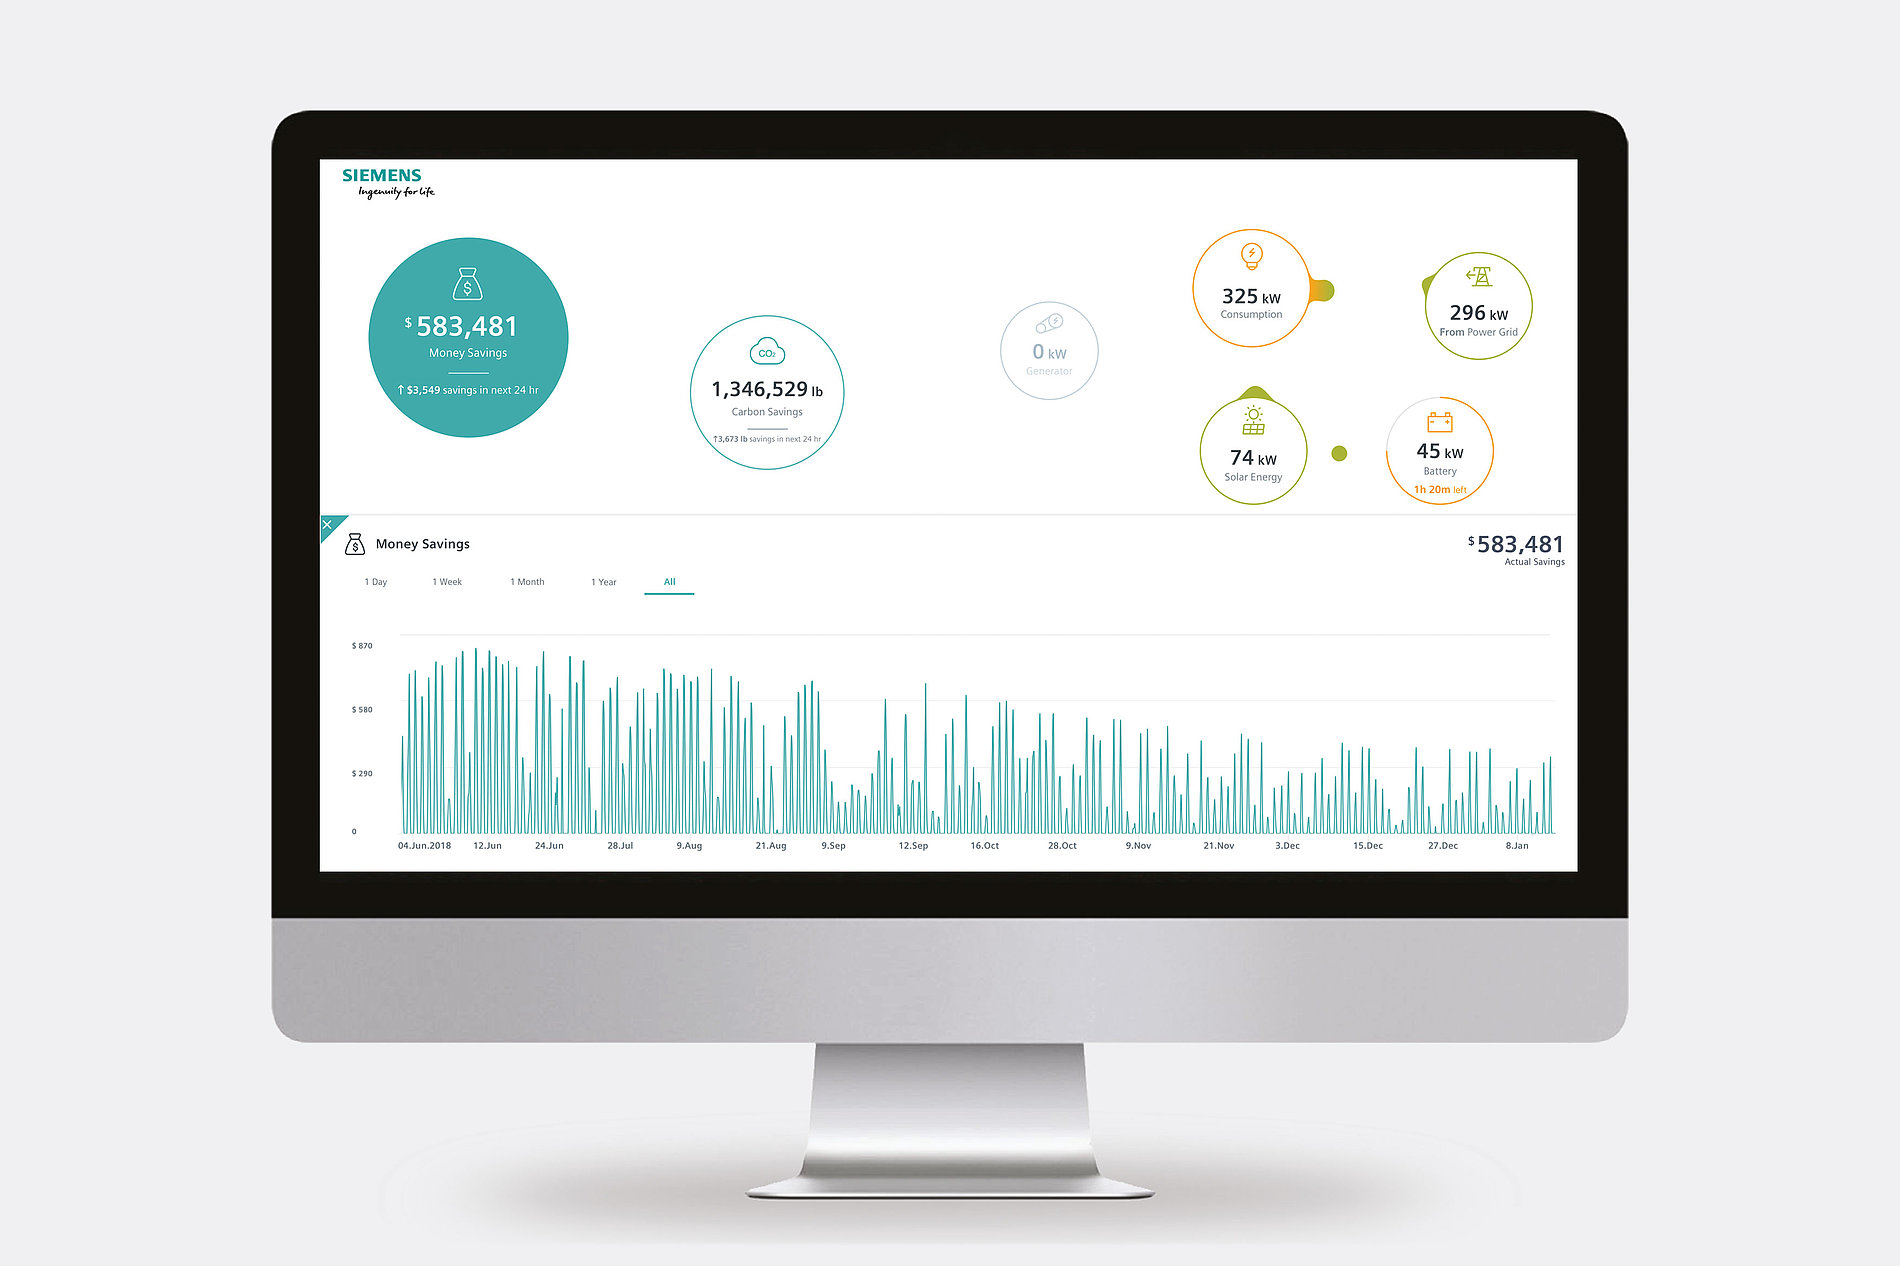
While the use of renewable energy is necessary to address growing demands on the power grid, a smart grid system that optimises energy flows between key system components also helps maximise cost and CO2 savings. The Princeton Island Grid Dashboard uses simple visual language to visualise the energy flow between renewable energy sources, the power grid, energy storage and energy consumers of a campus microgrid.
This visualisation helps the controller to optimise power flow ba-sed on consumption and demand patterns. Visualising energy flows in this manner also helps communicating information about power consumption, renewable power generation and cost savings to consumers in a simple and interactive way, therefore facilitating the understanding and promotion of renewable energy.
 点评此图
点评此图
 点评此图
点评此图
 点评此图
点评此图
参与人士
Company:
Siemens Corporation, United States
Design Lead:
Dr. Michael Jaentsch
Design:
Dr. Helmut Degen, Yao Tong

20赞 0评论 2749人气

39赞 0评论 3959人气

22赞 0评论 3850人气

19赞 0评论 2411人气
 关注
点赞
收藏
关闭弹幕
留言
关注
点赞
收藏
关闭弹幕
留言
确认要删除该条评论吗?
小小心意,大大鼓励
最高赞赏200元
使用支付宝扫描二维码完成支付
使用微信扫描二维码完成支付
当前余额:¥0.00
支付操作会向你普象账户的注册手机号发送验证码
请注意查收

扫一扫添加
普象商务
扫一扫添加
客服微信

扫一扫下载
手机APP

请关注公众号iamdesign或扫码关注
 沪公网安备 31011502009179号
沪ICP备13011487号-2 上海普象文化传播有限公司
沪公网安备 31011502009179号
沪ICP备13011487号-2 上海普象文化传播有限公司
留言板(0)